In my last post, I indicated that we need to get our expenses down by 25% if we have a hope of me successfully retiring at 40. By successful, I mean we don’t go broke before we die. Today, I thought I’d spend a bit of time looking at what our expenses consisted of last financial year.
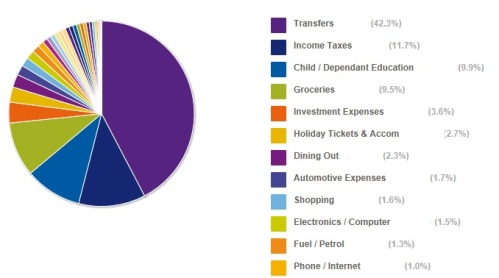
Figure 1: MsRichLife FY13-14 Expenses

Figure 2: MrRichLife FY13-14 Expenses
Savings (50.0%)
Last year we saved 42.3% of my net pay (after tax and rent) and about 65% of MrRichLife’s income. We could have done better than this, but as you’ll see we had some big, one off expenses last year which shouldn’t be repeated this year. It’s not too bad considering we weren’t being particularly conscious of our spending. There is much room for improvement though, and I’ve set the immediate goal of saving at least 50% of my net pay each month from here on.
Income Tax and Investment Expenses (12.0%)
Income taxes (in addition to what is taken from my pay) accounted for 11.7% of my expenses. Ouch! I called the ATO the other day and questioned how much I’m paying to them every three months and told them to go back through my payments to check they are correct. Guess what! I was overcharged $1500 and I can expect a refund soon. I hate how much I send to the Tax office, but there is little I can do to reduce the amount at this point. We are planning on selling one house soon and moving the cash into MrRichLife’s account, so that should help.
Investment Expenses mostly consists of Landlord insurance payments that are not taken care of by my property manager. They have slowly been creeping higher and higher and it’s about time I get some new quotes!
Rent (8.0%)
At the moment we are very happy with our rental arrangements so won’t be making any savings in this category.
Motorbike (6.8%)
MrRichLife bought himself a motorbike last year. Hopefully this one off expense won’t be repeated regularly!
Groceries, Dining Out & Alcohol (6.1%)
This category presents the biggest opportunity to make savings in our budget. These calculations don’t capture all the food and coffees we buy with cash, so in reality we are spending more on this category than indicated. I’d like to work with MrRichLife to work out a plan to reduce this item significantly. I’ll endeavour to write a separate post on what we come up with.
Childcare (4.8%)
In reality we get 50% Child Care Rebate so this expense is not as big as shown here. We could cut back on days, but honestly we think we’ve found the right balance for our family with The Boy in childcare for 2-3 days a week.
Bills (2.9%)
Gas, Electricity, Phone, Internet, Insurance and Medical. I know that our Gas and Electricity usage has crept up this year. We’ve recently had our central heating replaced so hopefully that will be operating more efficiently than the old one.
Holidays (2.0%)
Most of our holiday expenses have been incurred in visiting our families interstate. This also includes flights that I’ve already paid for an upcoming trip to see my family and attend to my high school reunion. We’ve also been away for a couple of weekends as a family. I love to travel and am prepared to cut other things out of our budget to ensure we can continue to do so. I don’t intend to reduce spending in this category, and actually expect it to rise this year.
Emergency Cash (2.0%)
We keep a bit of cash available in case of emergency, so this isn’t actually an expense. The withdrawal hopefully shouldn’t need to be repeated in future.
Car (1.8%)
We only have one car, and we don’t put a lot of kilometres on it each week. MrRichLife does most of the maintenance himself to save some money. I could ride my bike some of the time to save a bit of fuel and wear and tear, so I’ll revisit that topic in a separate post.
Job Expenses (1.1%)
Most of these expenses are reimbursed or tax deductible, so this category needs no work.
Other (4.3%)
The ‘other’ category captures all the smaller categories, that do add up to a lot. These are things like shopping, clothes, entertainment, hobbies, personal care etc. Given that all these ‘little’ expenses add up to a large chunk of our budget, we probably should see where we can cut down.
Summary
That was an interesting exercise to undertake. The most expenses were incurred through extra income tax payments and investments expenses. This is something I need to spend some time analysing further. There were also quite a lot of one off purchases and withdrawals last year which shouldn’t be repeated this year. The next biggest opportunities for improvement are in the ‘food’ and ‘other’ category. It might be worth setting ourselves some challenges to start bringing these expenses down.